Overview
CSV is still one of the most universal interfaces in analytics. It is exported by databases, generated by monitoring systems, shared between teams, and used every day by analysts, engineers, finance teams, operations staff, and domain specialists. The problem is not that the data is in CSV. The problem begins when a simple inspection question suddenly requires notebooks, code, or a handoff to somebody else.
CSV X-Ray is designed to remove that friction. It gives users a direct way to inspect anomalies, short-term predictive behaviour, and hidden structural patterns without forcing them into a machine-learning workflow.
What CSV X-Ray is for
Fast inspection, exploratory analysis, validation, one-off forecasting, and structural understanding.
What CSV X-Ray is not for
Continuous monitoring, API orchestration, alerting pipelines, or large-scale production automation.
The Real Problem Is Friction, Not Data
In our extended article available here, we make a deliberately important point: CSV is not the problem. CSV is the universal interface of data exchange — exported by databases, emitted by network elements, generated by industrial sensors, and passed between teams and vendors. The real issue is that intelligence is no longer colocated with the data. Users are forced into migration, toolchain choices, reformats, and organizational dependencies before they can answer inspection-level questions.
Most of those questions are exploratory rather than “full machine learning” problems:
- Does this point look wrong?
- Is this behaviour unusual compared with the rest?
- Is this time series drifting?
- Is there hidden structure across these variables?
Two Analytical Modes: Time-Oriented vs Static
Before analysis begins, CSV X-Ray forces one explicit decision: what kind of dataset is this? That design choice is central to the results reliability. The article distinguishes between time-oriented datasets and static datasets, because analytical mistakes often occur when temporal assumptions are applied blindly, or ignored entirely.
| Mode | Assumption | Typical examples | System behaviour |
|---|---|---|---|
| Time-oriented | Order matters; trends, seasonality, and drift exist | Network KPIs, sensor measurements, financial indices, system metrics | Preserves temporal order, analyses deviations over time, enables forecasting |
| Static | Order is irrelevant; each row is an independent observation | Transactions, customer profiles, risk datasets, player statistics | Compares points against the population, focuses on isolation, density, and structure |
Starting with a Dataset
The recommended flow begins with optional example datasets. These datasets are downloaded locally to the user’s machine, not ingested silently, so users can inspect the CSV structure themselves before uploading anything back into the tool. This is both a usability choice and a trust signal.
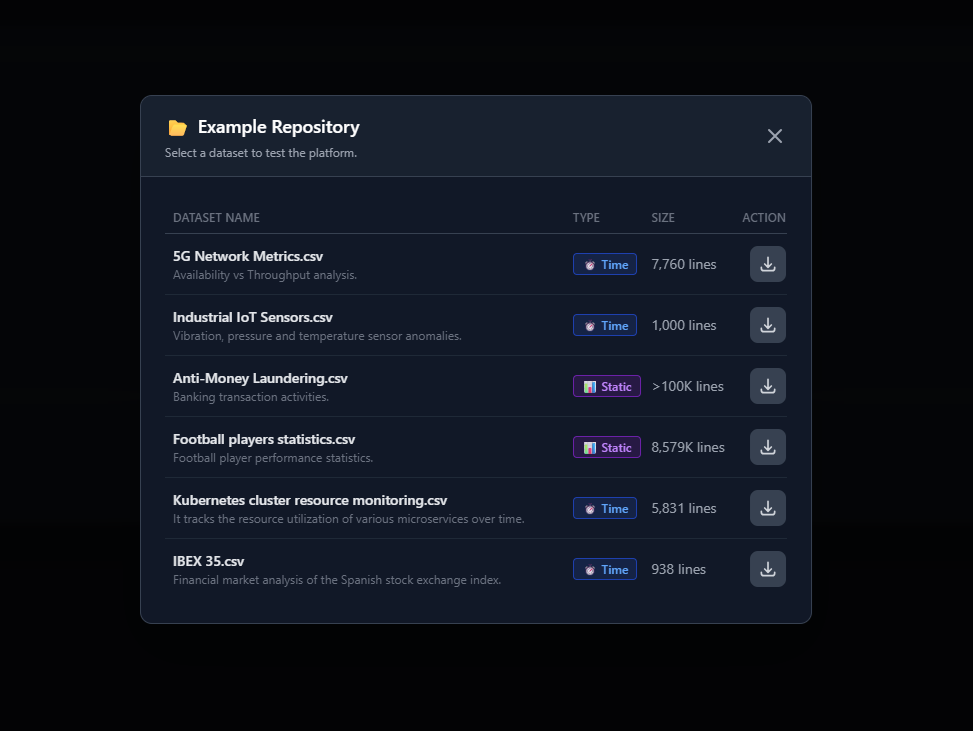
The above screenshot shows the example repository with datasets such as 5G network metrics, industrial IoT sensors, anti-money-laundering records, football player statistics, Kubernetes resource monitoring, and IBEX price data.
Filtering Is Part of the Analysis
In CSV X-Ray, filtering is not a cosmetic convenience. It is part of the analytical workflow. Anomalies are often contextual. What looks abnormal in the full population may be normal inside a specific segment, and vice versa.
That is why filtered views matter. A user may want to inspect:
- a specific application,
- a subset of stores,
- one machine family,
- one date interval,
- one region or product category.
Always-On Anomaly Detection
Once a dataset is loaded, CSV X-Ray continuously evaluates deviation from typical behaviour. Users do not need to choose algorithms, guess thresholds, or translate an inspection problem into an ML configuration problem.
The system is designed to make anomaly inspection immediate:
- identify unusual points or periods,
- inspect anomaly intensity over time,
- see how anomalies respond when filters are applied,
- use structure and context instead of isolated single-field alerts.
Forecasting When Time Matters
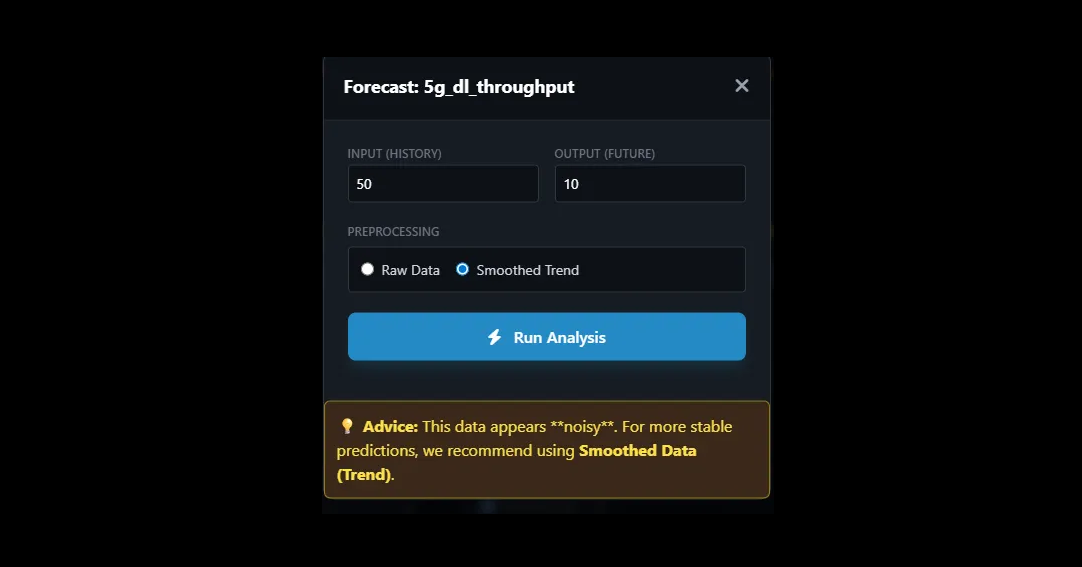
For time-oriented datasets, CSV X-Ray exposes short-term forecasting directly from the interface. Users can choose a numerical variable, define the input history size, set the output horizon, and decide whether to work from raw data or a smoothed trend.
| User control | Purpose |
|---|---|
| History length | How much recent information should be used as forecast input |
| Forecast horizon | How far into the future the prediction should extend |
| Raw vs smoothed trend | Trade off sensitivity against robustness when the series is noisy |
When a series is noisy, CSV X-Ray can guide the user toward smoother representations so the forecast remains more stable and interpretable. The goal is not to hide model behaviour. It is to make it understandable.
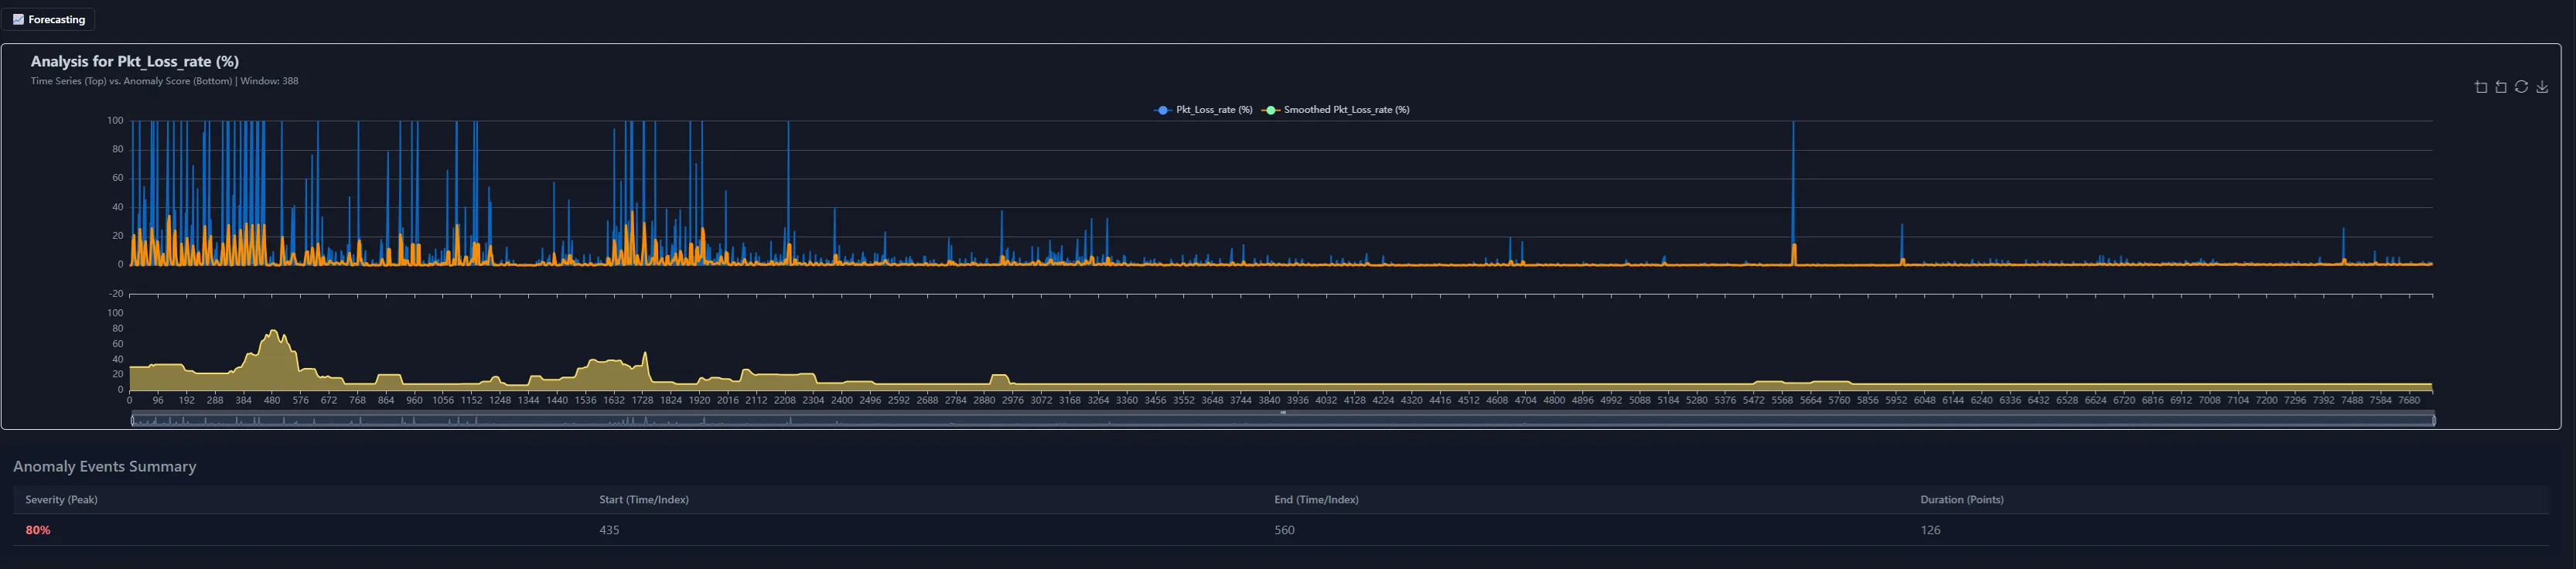
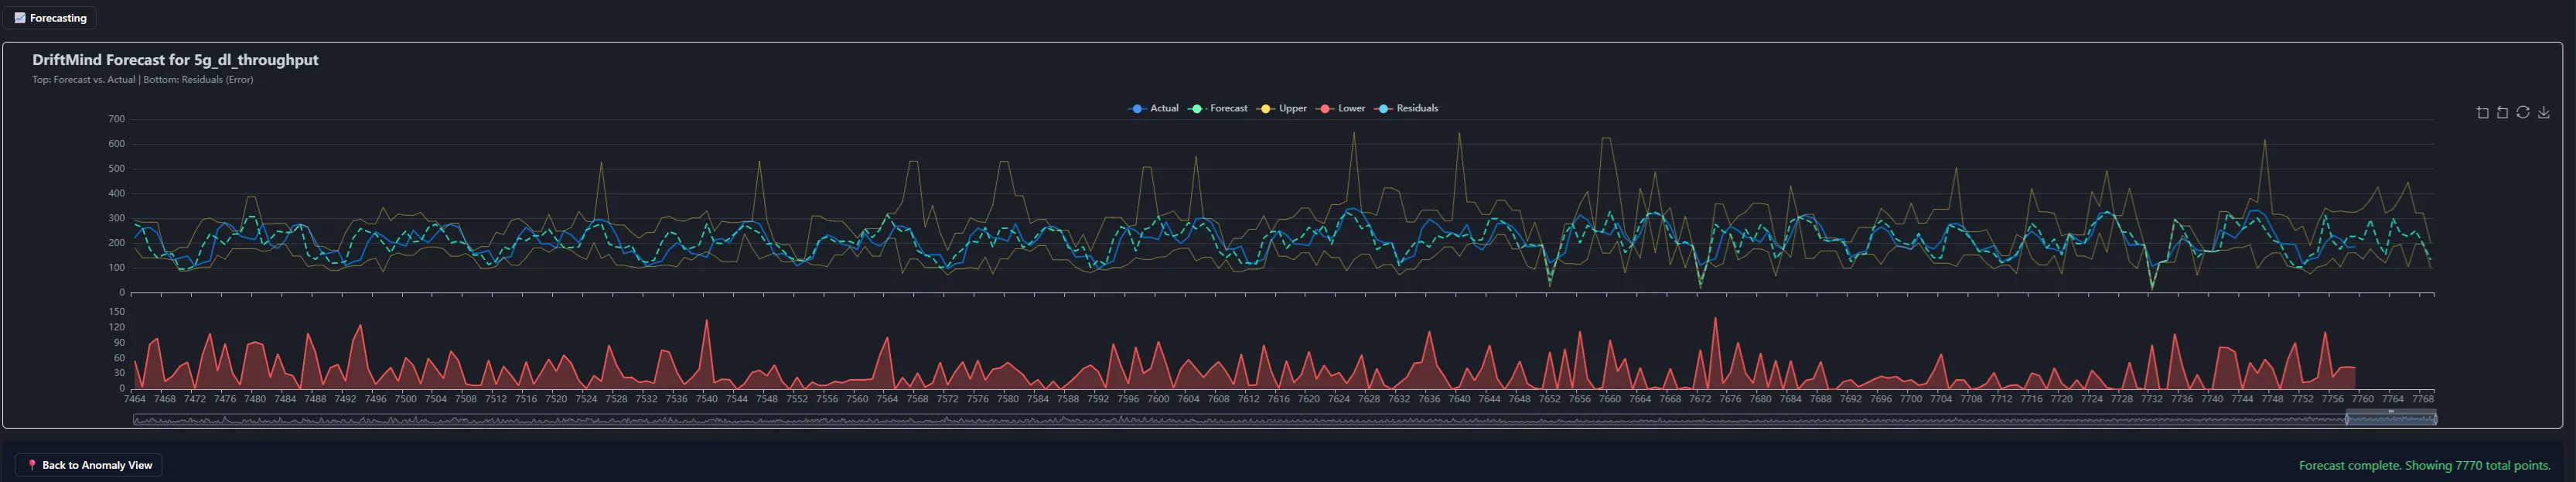
The figure below illustrates how DriftMind performs forecasting in a streaming-like manner. Instead of generating a single batch forecast, the model produces predictions sequentially for each incoming data point, effectively replaying the signal as if it were arriving in real time. The upper chart displays the observed signal together with the predicted values and their associated confidence interval. This interval reflects the model’s estimated uncertainty around each forecast. The lower chart shows the absolute prediction error over time, providing a direct view of the model’s accuracy as new observations arrive.
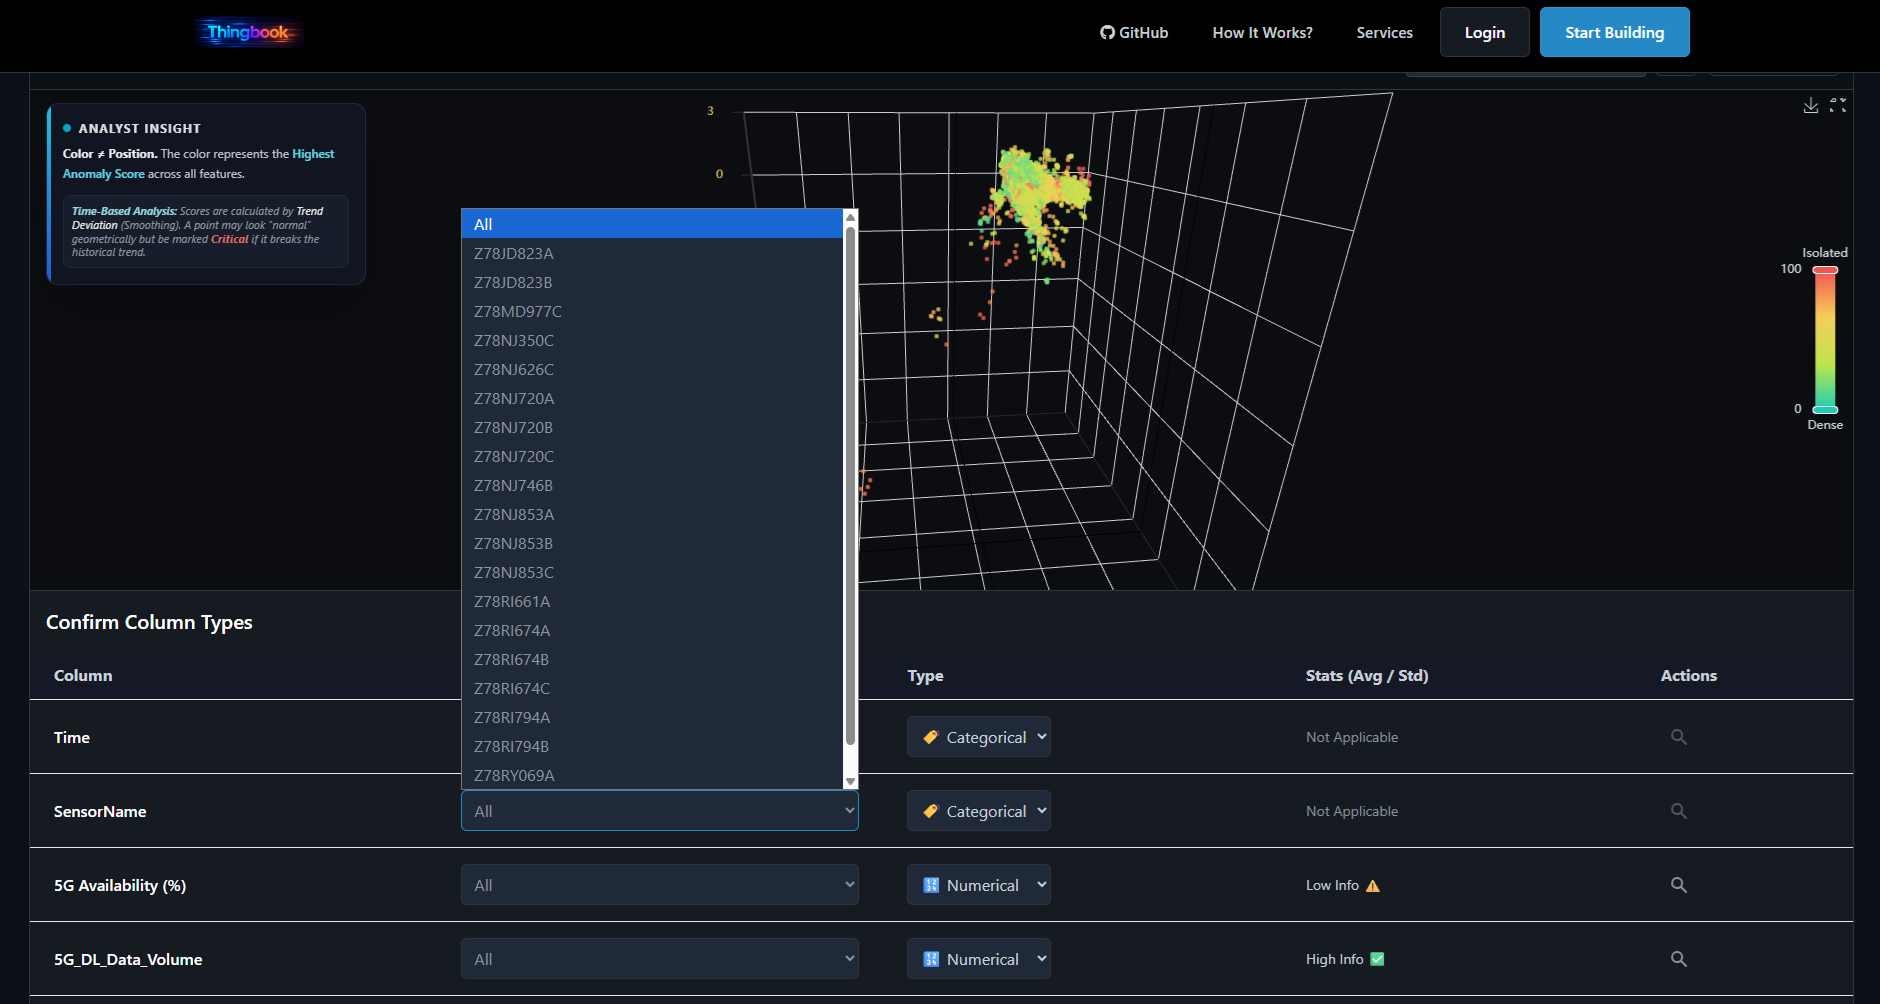
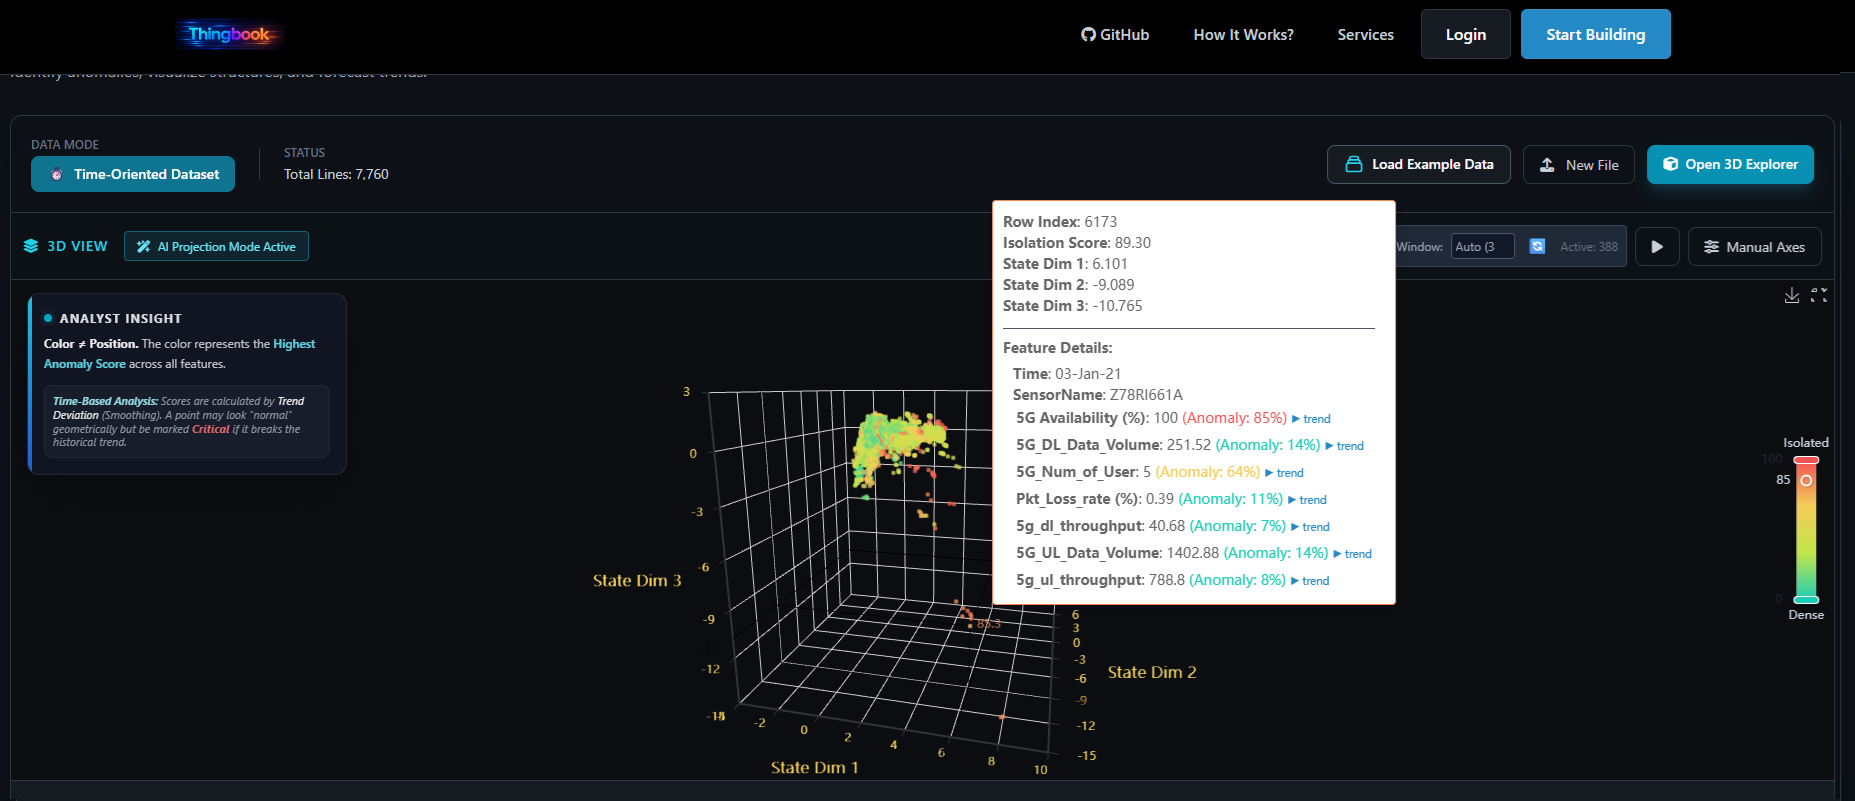
3D Structure and Dimensionality Reduction
Not every pattern reveals itself in a table or line chart. CSV X-Ray includes dynamic visual exploration so users can inspect dense regions, isolated points, clusters, and regime changes more intuitively.
When datasets become too high-dimensional for direct visualisation, the tool can project them into a lower-dimensional space to preserve useful structure for inspection. The purpose is practical: make hidden relationships visible quickly.
Why this matters
Many users can recognize outliers and behavioural regimes visually before they can formalize them analytically.
Why it fits CSV X-Ray
The tool is built for discovery, so visibility into structure is as important as numerical scoring.
Privacy and Trust
Trust is a design constraint in CSV X-Ray. Users should be able to inspect a dataset without worrying that the act of inspection turns into hidden collection, storage, or reuse.
The privacy stance is straightforward:
- no persistence layer for uploaded analysis data,
- no retention of user datasets,
- no training on uploaded user data,
- browser-local processing wherever possible,
- temporary in-memory handling for forecasting tasks.
Where CSV X-Ray Ends and DriftMind Begins
CSV X-Ray is intentionally scoped. It is built for fast inspection, exploratory analysis, validation, and one-off predictive exploration. It is not the system you use for continuous operational monitoring, automated alerting, or large-scale system integration.
| CSV X-Ray | DriftMind |
|---|---|
| Inspection-first tool | Production-grade engine |
| One-off and exploratory use | Continuous operational deployment |
| No-code interaction | Automation, repeatability, integration |
| Fast understanding | Scalable monitoring and embedded intelligence |